Meet Horizon UI · 7/16: The Log Explorer
This is the seventh post in the Meet Horizon UI series. Part 6 was one request’s spans; this one is the log lines around it. Horizon surfaces logs through two distinct tabs, because there are really two different questions: “what did this service log over the last half hour?” and “what is this pod printing to stdout right now?”
- The Logs tab queries the logs SkyWalking has already collected and stored — indexed, filterable, correlated with traces.
- The Pod Logs tab live-tails a Kubernetes pod’s container logs on demand — these aren’t stored logs at all: OAP reads them straight from the Kubernetes API server (the
kubectl logspath), Horizon shows the window, and it’s discarded. Nothing is persisted, and SkyWalking’s log storage is never involved.
Which tabs a layer shows is up to its template: the Logs tab appears on layers that enable it (General, Mesh, Nginx, the Envoy AI Gateway, the mobile and mini-program layers); the Pod Logs tab appears only on the Kubernetes-aware layers (Kubernetes Service, Mesh, Mesh data plane). Browser JavaScript errors are a different thing again — not service logs but client-side error events the browser agent reports, with their own categories and their own source-map de-obfuscation (turning a minified app.min.js:1:… frame back into your original file:line). That’s a separate tab on the Browser layer, and its own post later in the series.
The stored log stream
Open a layer that has a Logs tab, pick a service in the header, and its stored log stream loads newest-first. Like the trace explorer, this tab owns its own time range — the global topbar picker is paused while you’re here, so auto-refresh can’t shift the window out from under an investigation. Pick a rolling preset (last 15 minutes through 24 hours, default 30) or a custom absolute window; queries run at second precision so the most recent lines are never rounded off the minute.
A conditions bar narrows the stream, and every filter is optional and AND-joined:
- Instance — restrict to one service instance (labelled Sidecar on a sidecar layer).
- Endpoint — type to search the service’s endpoints, click to pin, × to clear.
- Trace ID — show only the lines correlated with one trace. This is also how a log lands when you arrive from a trace: the field pre-fills and the stream is already scoped.
- Tags — a single
key=valuefield with autocomplete; start a key to see suggestions, type=to switch to known values, Enter to commit. Committed tags ride along as removable chips. - Level — the Levels strip above the stream doubles as a filter: click
error,warn,info, ordebugto keep only that level, click again to clear.
There’s no log query language here — no LogQL box to learn. The conditions above are the whole surface, and edits refresh the stream as you make them; Run query is just the explicit “I’m done editing, refresh now” button that resets to the first page.
Reading the stream
The point of a log view isn’t to list lines, it’s to find the shape in them — so the stream comes with two pieces of orientation above it.
A density histogram plots log count over time, each bar stacked by level in the legend’s colors; hover a bar for that bucket’s time range and per-level counts. It’s drawn from the page currently on screen, so it shows the shape of what you’re looking at. And the Levels strip carries a running count per level — sampled across the window, not just the visible page, so the error/warn/info mix reflects the whole window you’re querying.
Each row then shows the timestamp, the level (the row is color-keyed to it), the service, an ↗ trace link when the line is trace-correlated, a JSON / YAML / TEXT format chip, and a one-line preview of the content. Horizon decides that chip by what the payload actually is: OAP labels a body JSON or plain text, and on top of that Horizon sniffs for JSON and YAML structure, so an unlabelled-but-structured line still gets the right treatment — JSON flattened to one line in the preview, YAML keeping its keys, plain text whitespace-collapsed.
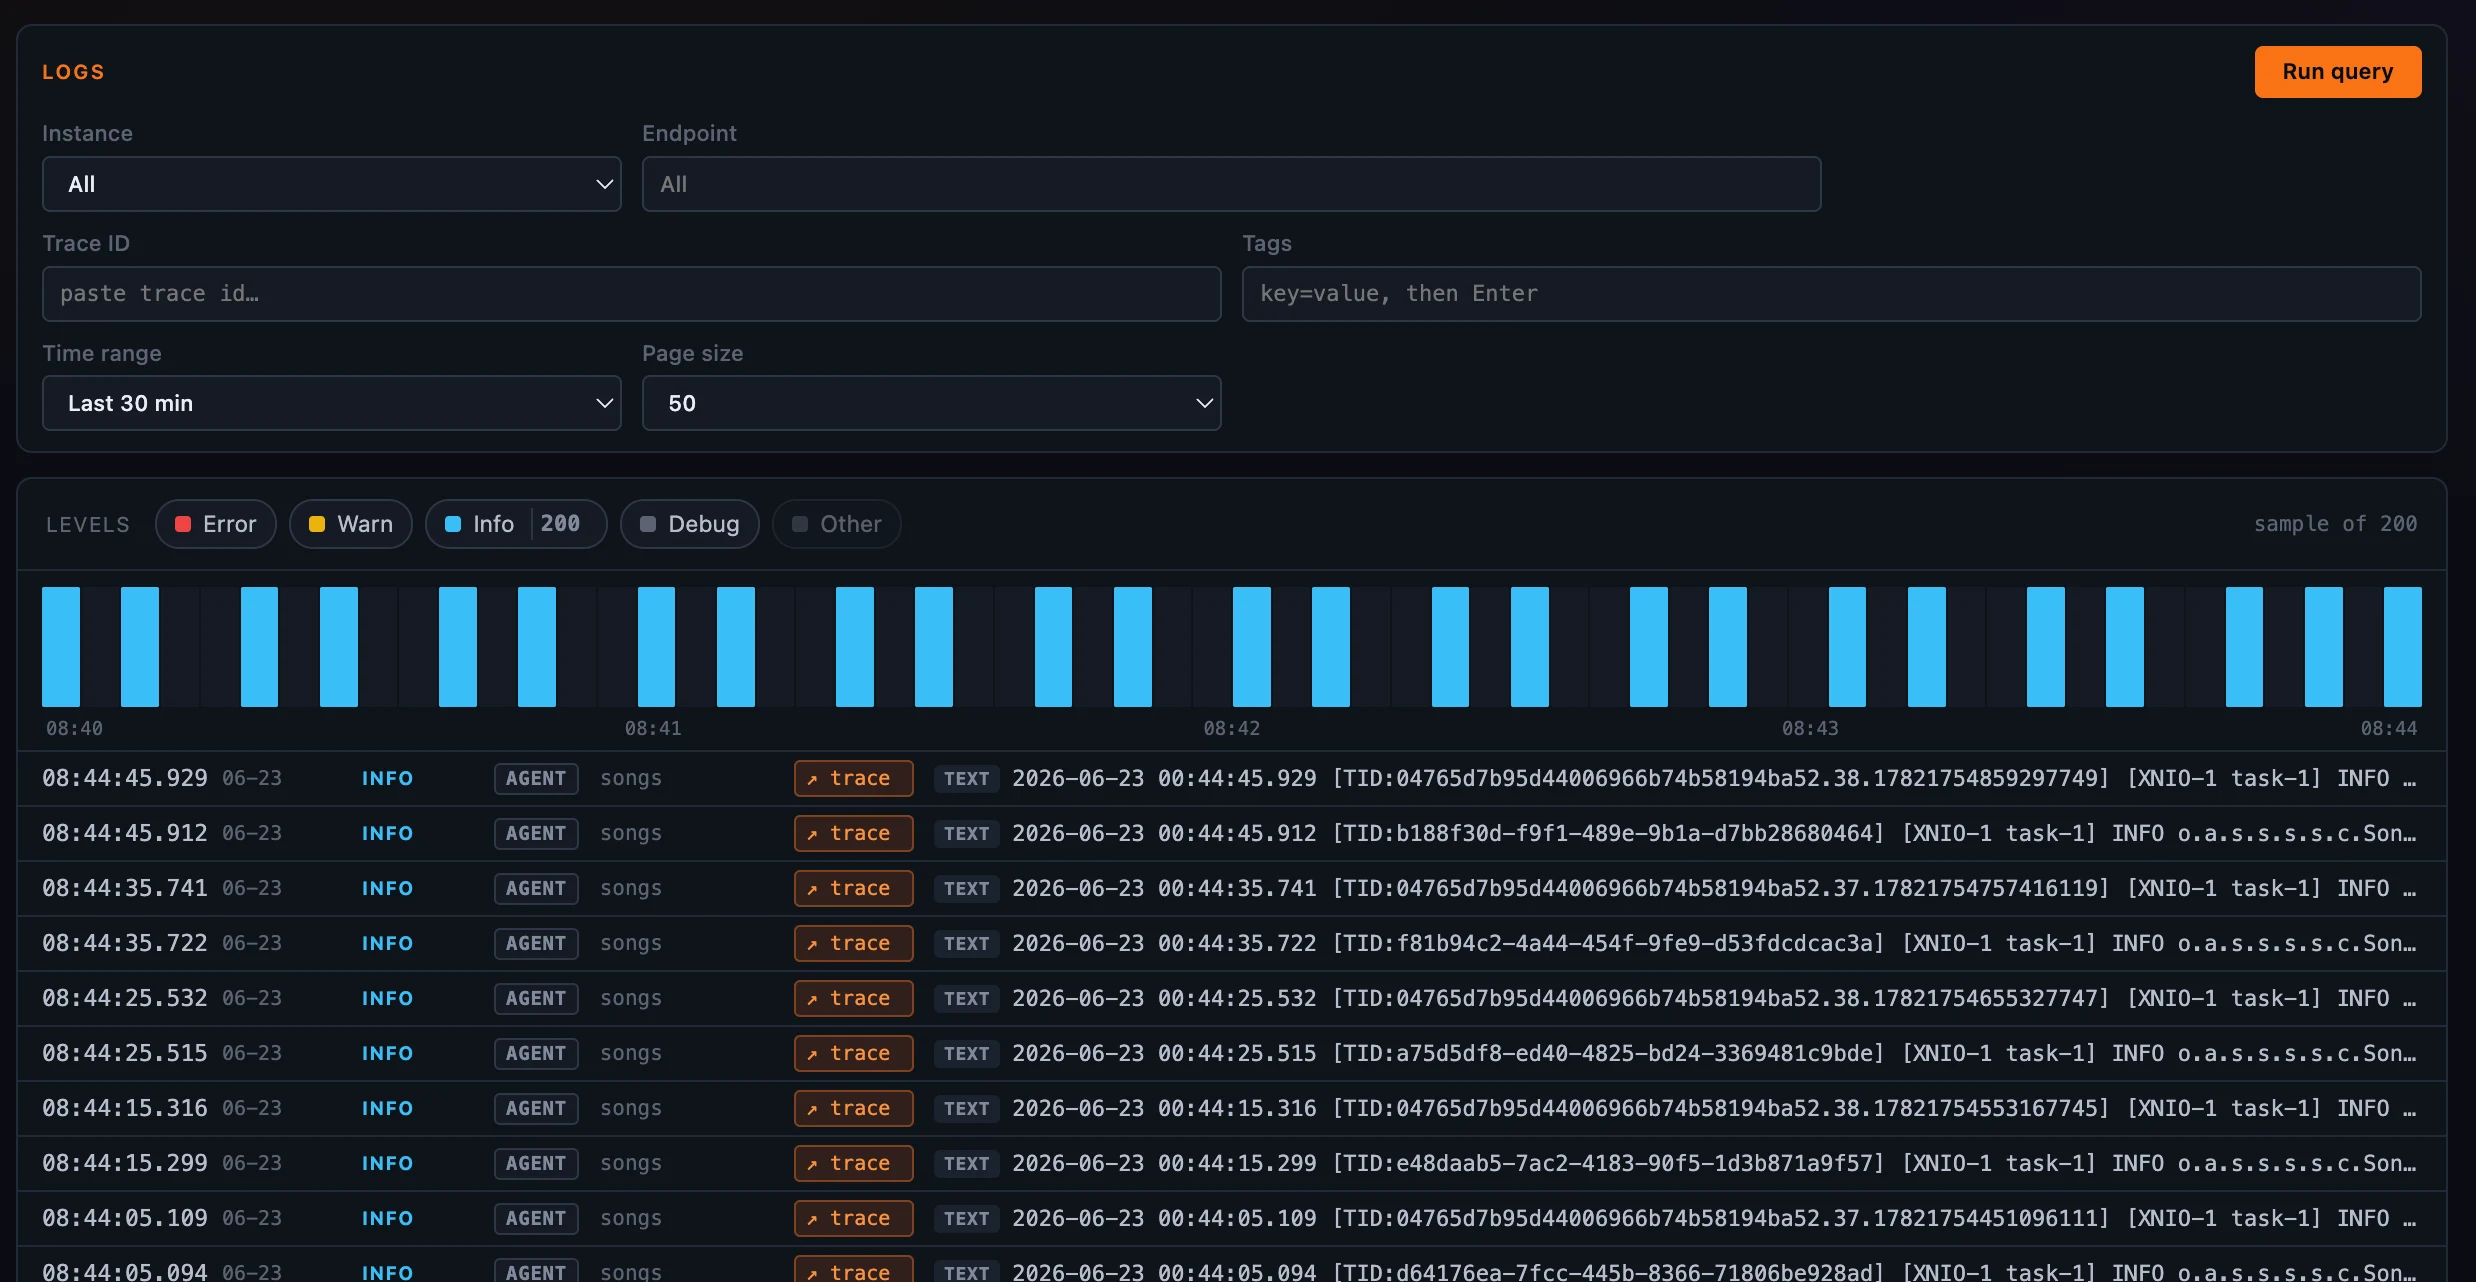 Figure 1: A service’s stored log stream — a level histogram and level counts over the window, then the rows, each tagged JSON / YAML / TEXT and linked to its trace.
Into a single line
Click a row and the full payload opens in a popout: the complete content with format-aware pretty-printing — JSON and YAML laid out properly, plain text given the whole canvas instead of a cramped strip — plus a Copy button, the service / instance / endpoint / trace context, and a table of every tag on the line. When the line is trace-correlated, an ↗ trace button opens the related trace’s waterfall in an overlay without leaving the stream — and it passes the row’s timestamp along, so the trace is found even when it has aged into a colder storage tier. Escape or a backdrop click closes it.
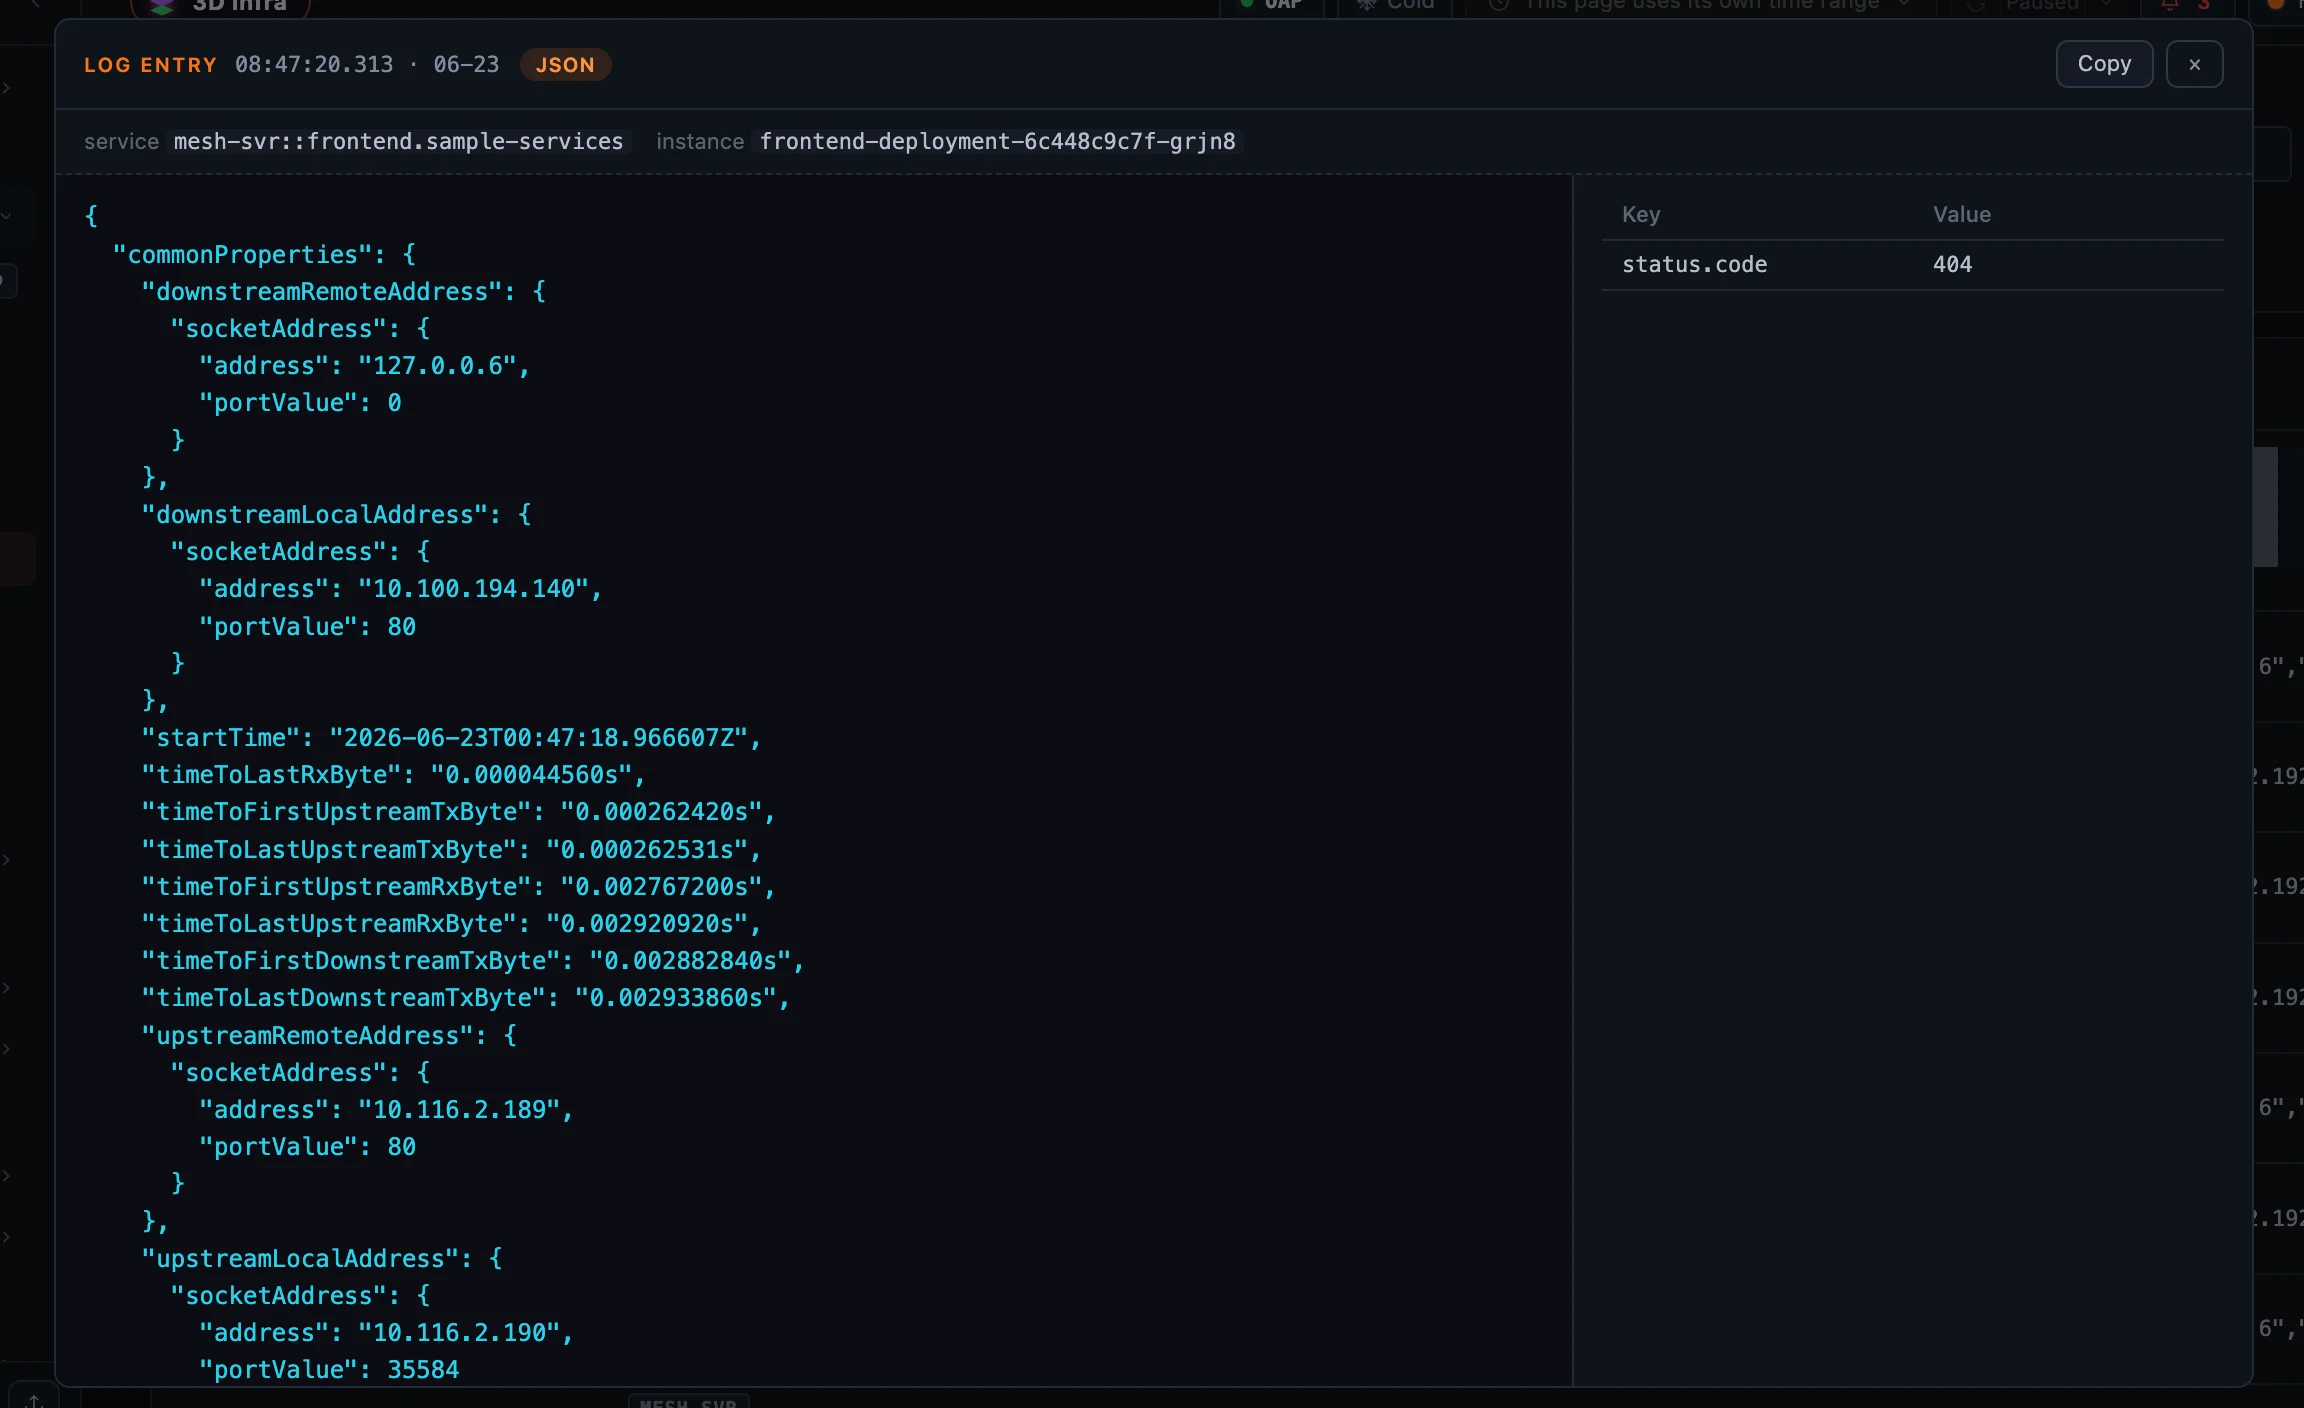 Figure 2: One line in full — its payload pretty-printed by format, with its context and every tag laid out beside it.
Pod Logs: tailing what’s printing right now
The Pod Logs tab answers the other question, and it’s a fundamentally different source: not SkyWalking’s stored logs, but the pod’s container output read live from the Kubernetes API server through OAP — the exact thing kubectl logs -f reads. There’s no stored history to page through; each refresh pulls the trailing window, shows it, and throws it away.
Starting a tail is a few picks: choose a Pod (one service instance, pinned), a Container (Horizon lists the pod’s containers and selects the first), a look-back Window (last 30s, 1m, 5m, 15m, or 30m — how far back each poll reaches), and a poll Interval (2s, 5s, 10s, or 30s — how often it re-fetches). Press Start and the window streams into a read-only viewer that keeps the newest line in view and re-polls until you Pause; a header strip shows the container, the line count, a live indicator, and how long ago it last updated. Two Include / Exclude filter rows narrow what you see — each chip is a full-line regular expression (.*error.*) evaluated by OAP, so they match the whole line rather than a substring, and they stack.
One thing to know going in: on-demand pod logs are disabled by default on OAP, because container output can carry secrets. When the feature is off — or when the pod you picked has been rolled or scaled away — OAP returns a reason, and Horizon shows it in a banner rather than an empty pane, so you can tell “turn this on” apart from “that pod is gone.”
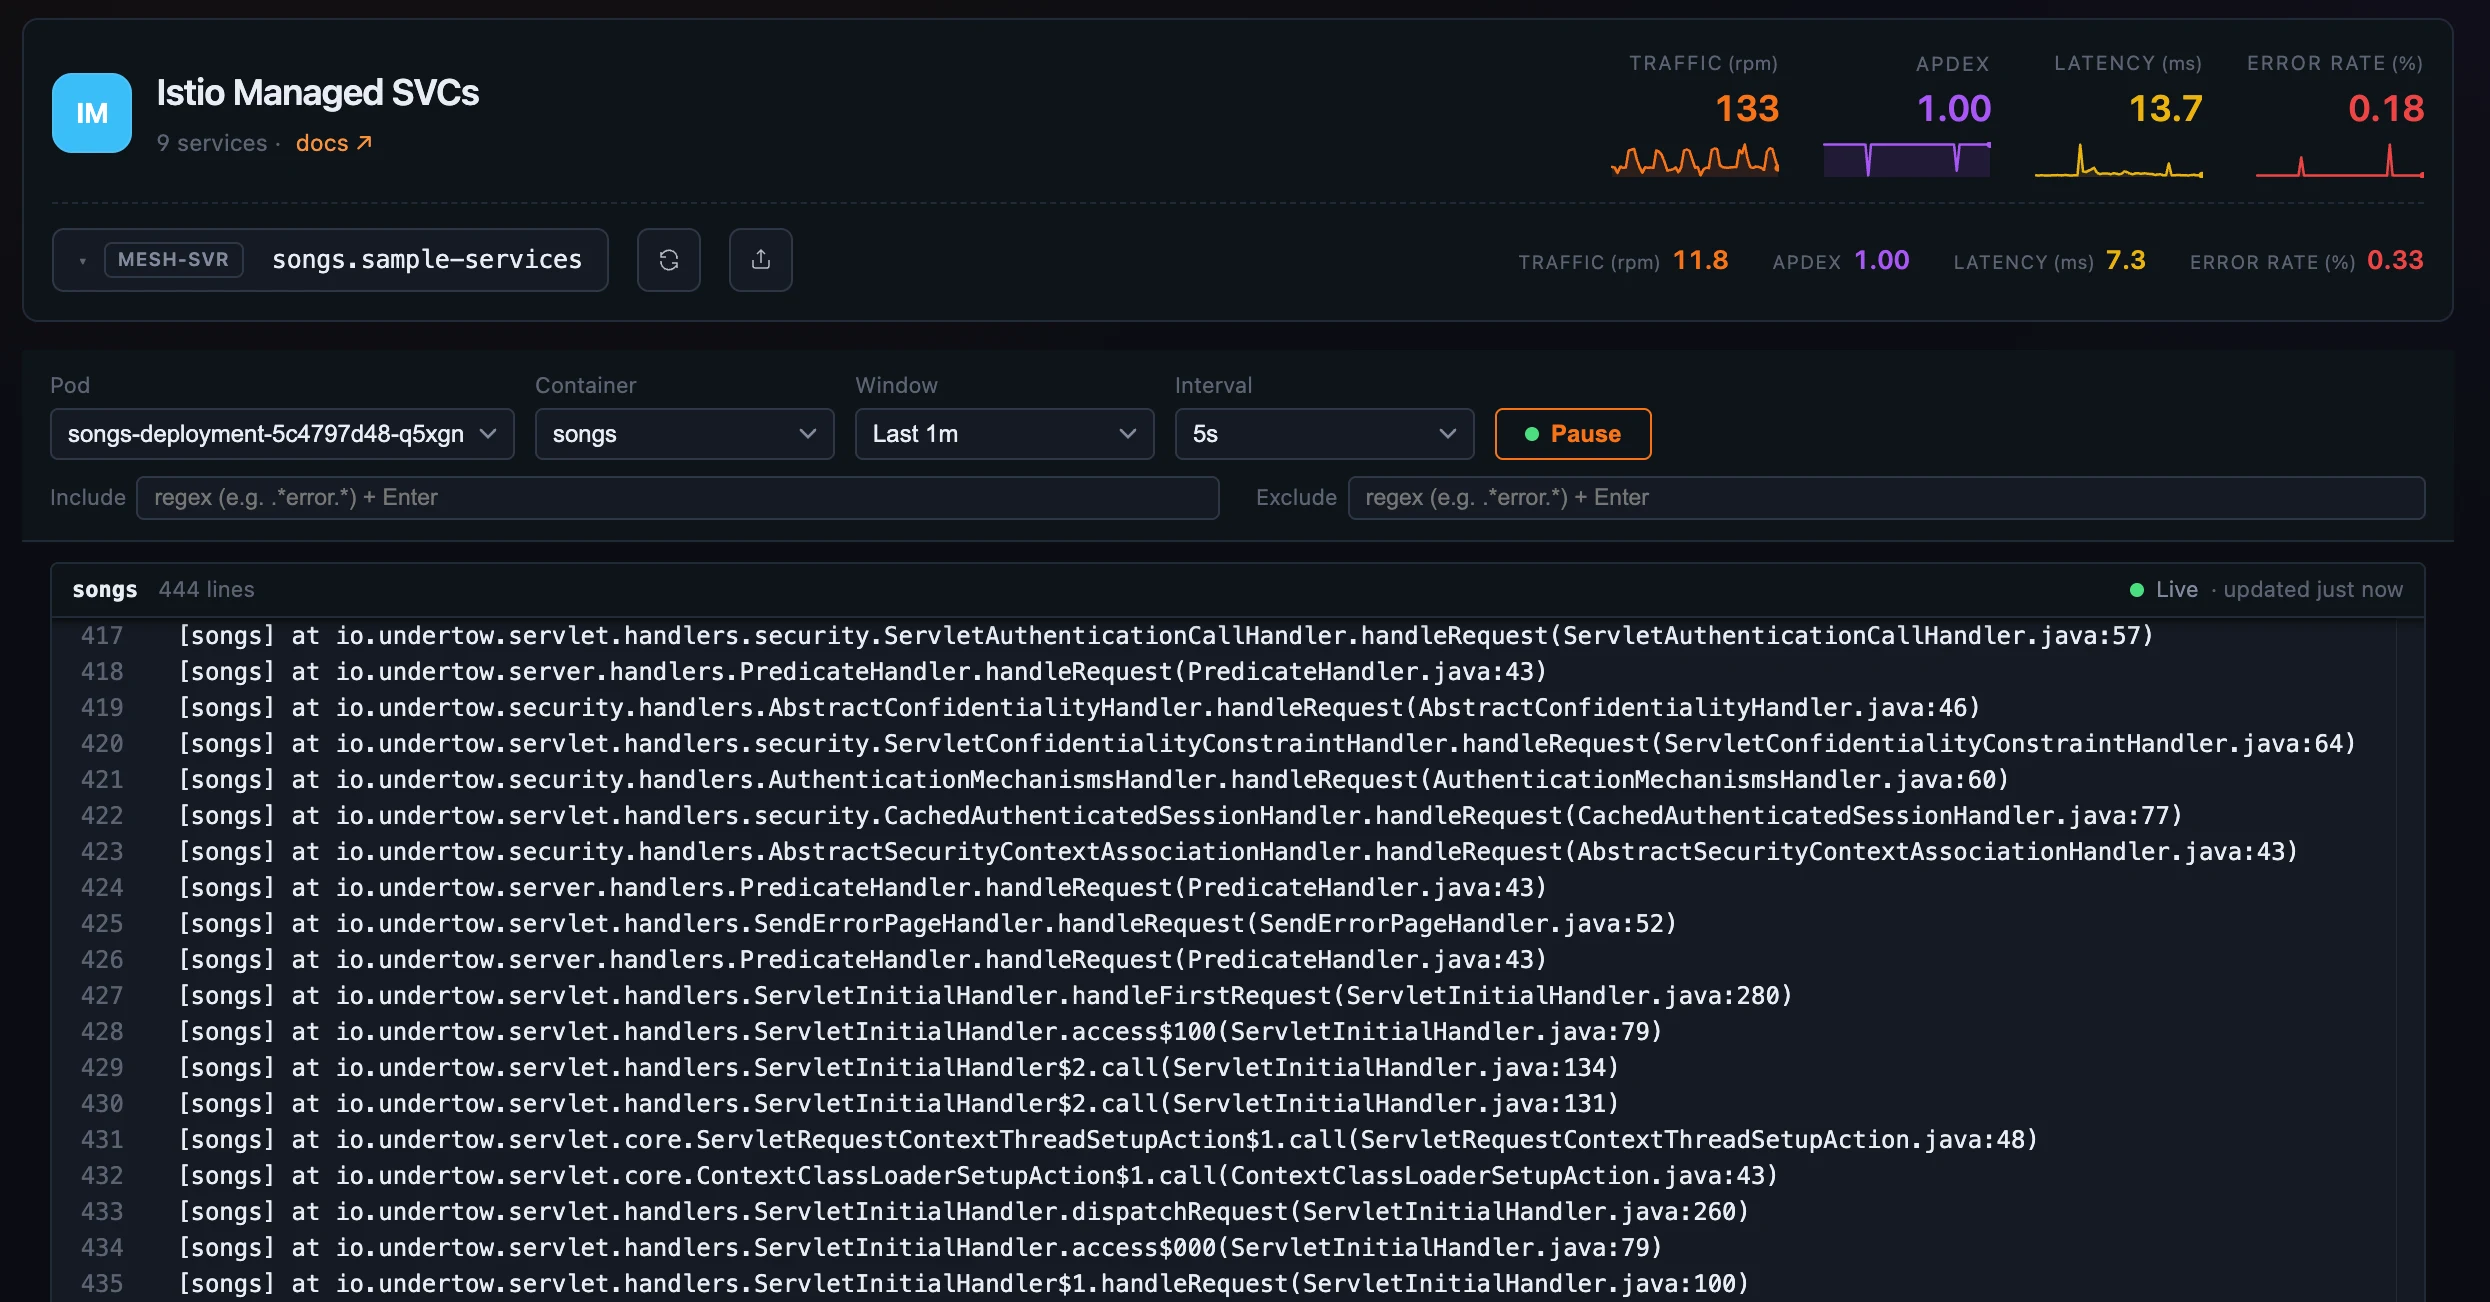 Figure 3: A live tail of one pod’s container — windowed, interval-polled, regex-filterable, never persisted.
Where to go next
Both tabs — the stored queries, the tag and container autocomplete, and the live tail — are gated by a single logs:read permission, so granting “can read logs” is one switch. For the field reference — every condition, the histogram, the Pod Logs windows and filters — see the Logs docs.
Next up: Browser & RUM monitoring — the browser agent’s own error stream, and de-obfuscating a minified stack with source maps.