Meet Horizon UI · 13/17: Platform & Cluster Introspection
This is the thirteenth post in the Meet Horizon UI series, and the last stop in Act 3 — operate it. The earlier operate posts were about acting on the backend — alarms, runtime rules, the live debugger, cross-layer inspect. This one turns the lens around onto the backend itself: is it healthy, how is it configured, and how long does it keep your data? Three read-only surfaces under Platform monitoring answer exactly those questions — no knobs, just the facts you need when you’re triaging.
Cluster Status: is the backend healthy, and on which port?
Horizon talks to OAP over more than one channel, and Cluster Status shows the health of each one separately. It’s a two-port view with a third, independent probe:
- Query / GraphQL (
:12800) — the port every observability page rides. It reports OAP’s version, the server’s timezone and clock (next to your browser’s), and OAP’s own health score. This works on any OAP, 10.x included. - Admin host (
:17128) — the port the operate features need. Each admin module is probed live: the page GETs the exact REST path the feature calls and reports whether it answers, alongside theSW_…env var that enables it and what breaks if it’s down —admin-server,receiver-runtime-rule,dsl-debugging,inspect,ui-management. This host ships with OAP 11, so on a 10.x backend the pane simply isn’t there. - Zipkin / OTLP (
:9412) — informational: it feeds only the Zipkin trace menu, so a red dot here leaves every other page working.
All three are polled independently, so one going red never drags the others down — which is precisely what makes this the first page to open when something elsewhere in Horizon looks off.
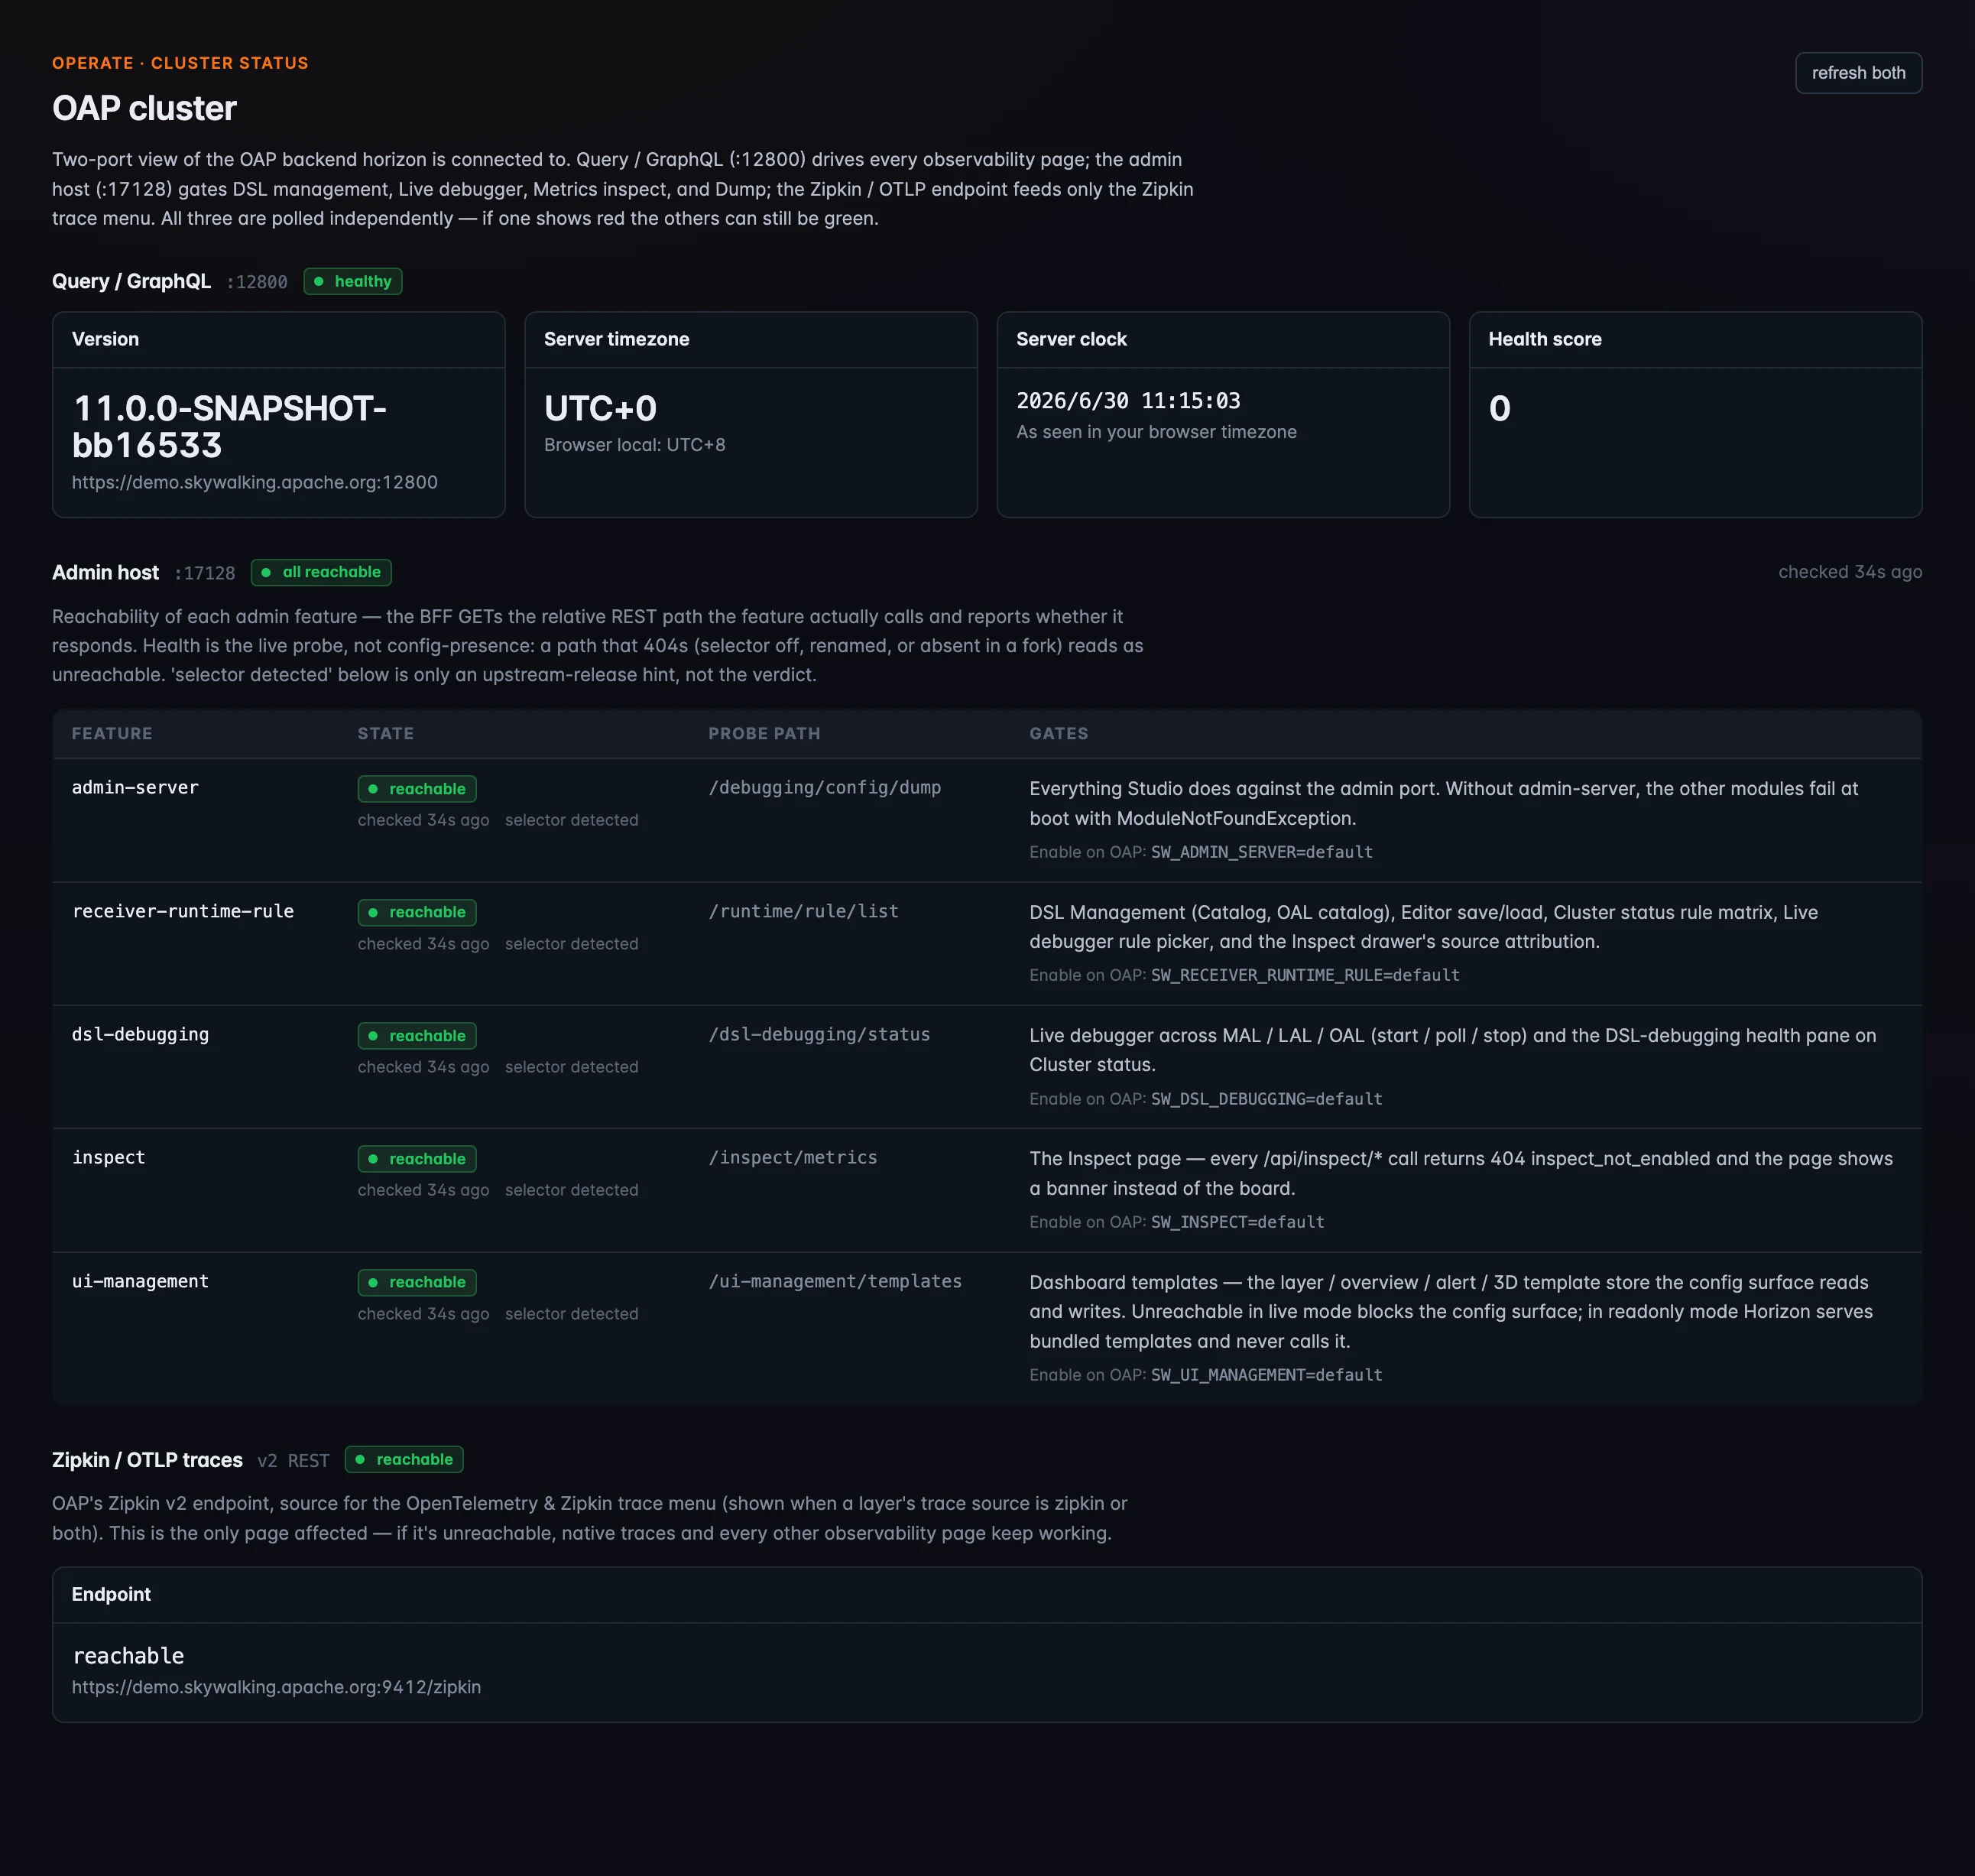 Figure 1: Cluster Status — a two-port health view. The Query pane (
:12800, any OAP) shows version, server time, and health score; the Admin pane (:17128, OAP 11) probes each admin module live with its REST path, the SW_… env var that enables it, and what breaks if it’s unreachable; the Zipkin/OTLP pane feeds only the Zipkin menu.
OAP Configuration: what is it actually running?
When a setting doesn’t behave the way you expect, the next question is “what config did OAP actually resolve?” OAP Configuration answers it without an SSH session: it reads the connected backend’s effective runtime config from the admin port’s /debugging/config/dump, grouped by module and searchable across keys and values. Secret values — passwords, tokens, access keys — are masked to ****** by OAP itself before Horizon ever sees them. It’s strictly read-only; to change a value you still edit it on the OAP side and restart. Like the admin pane above, it rides OAP 11’s admin host.
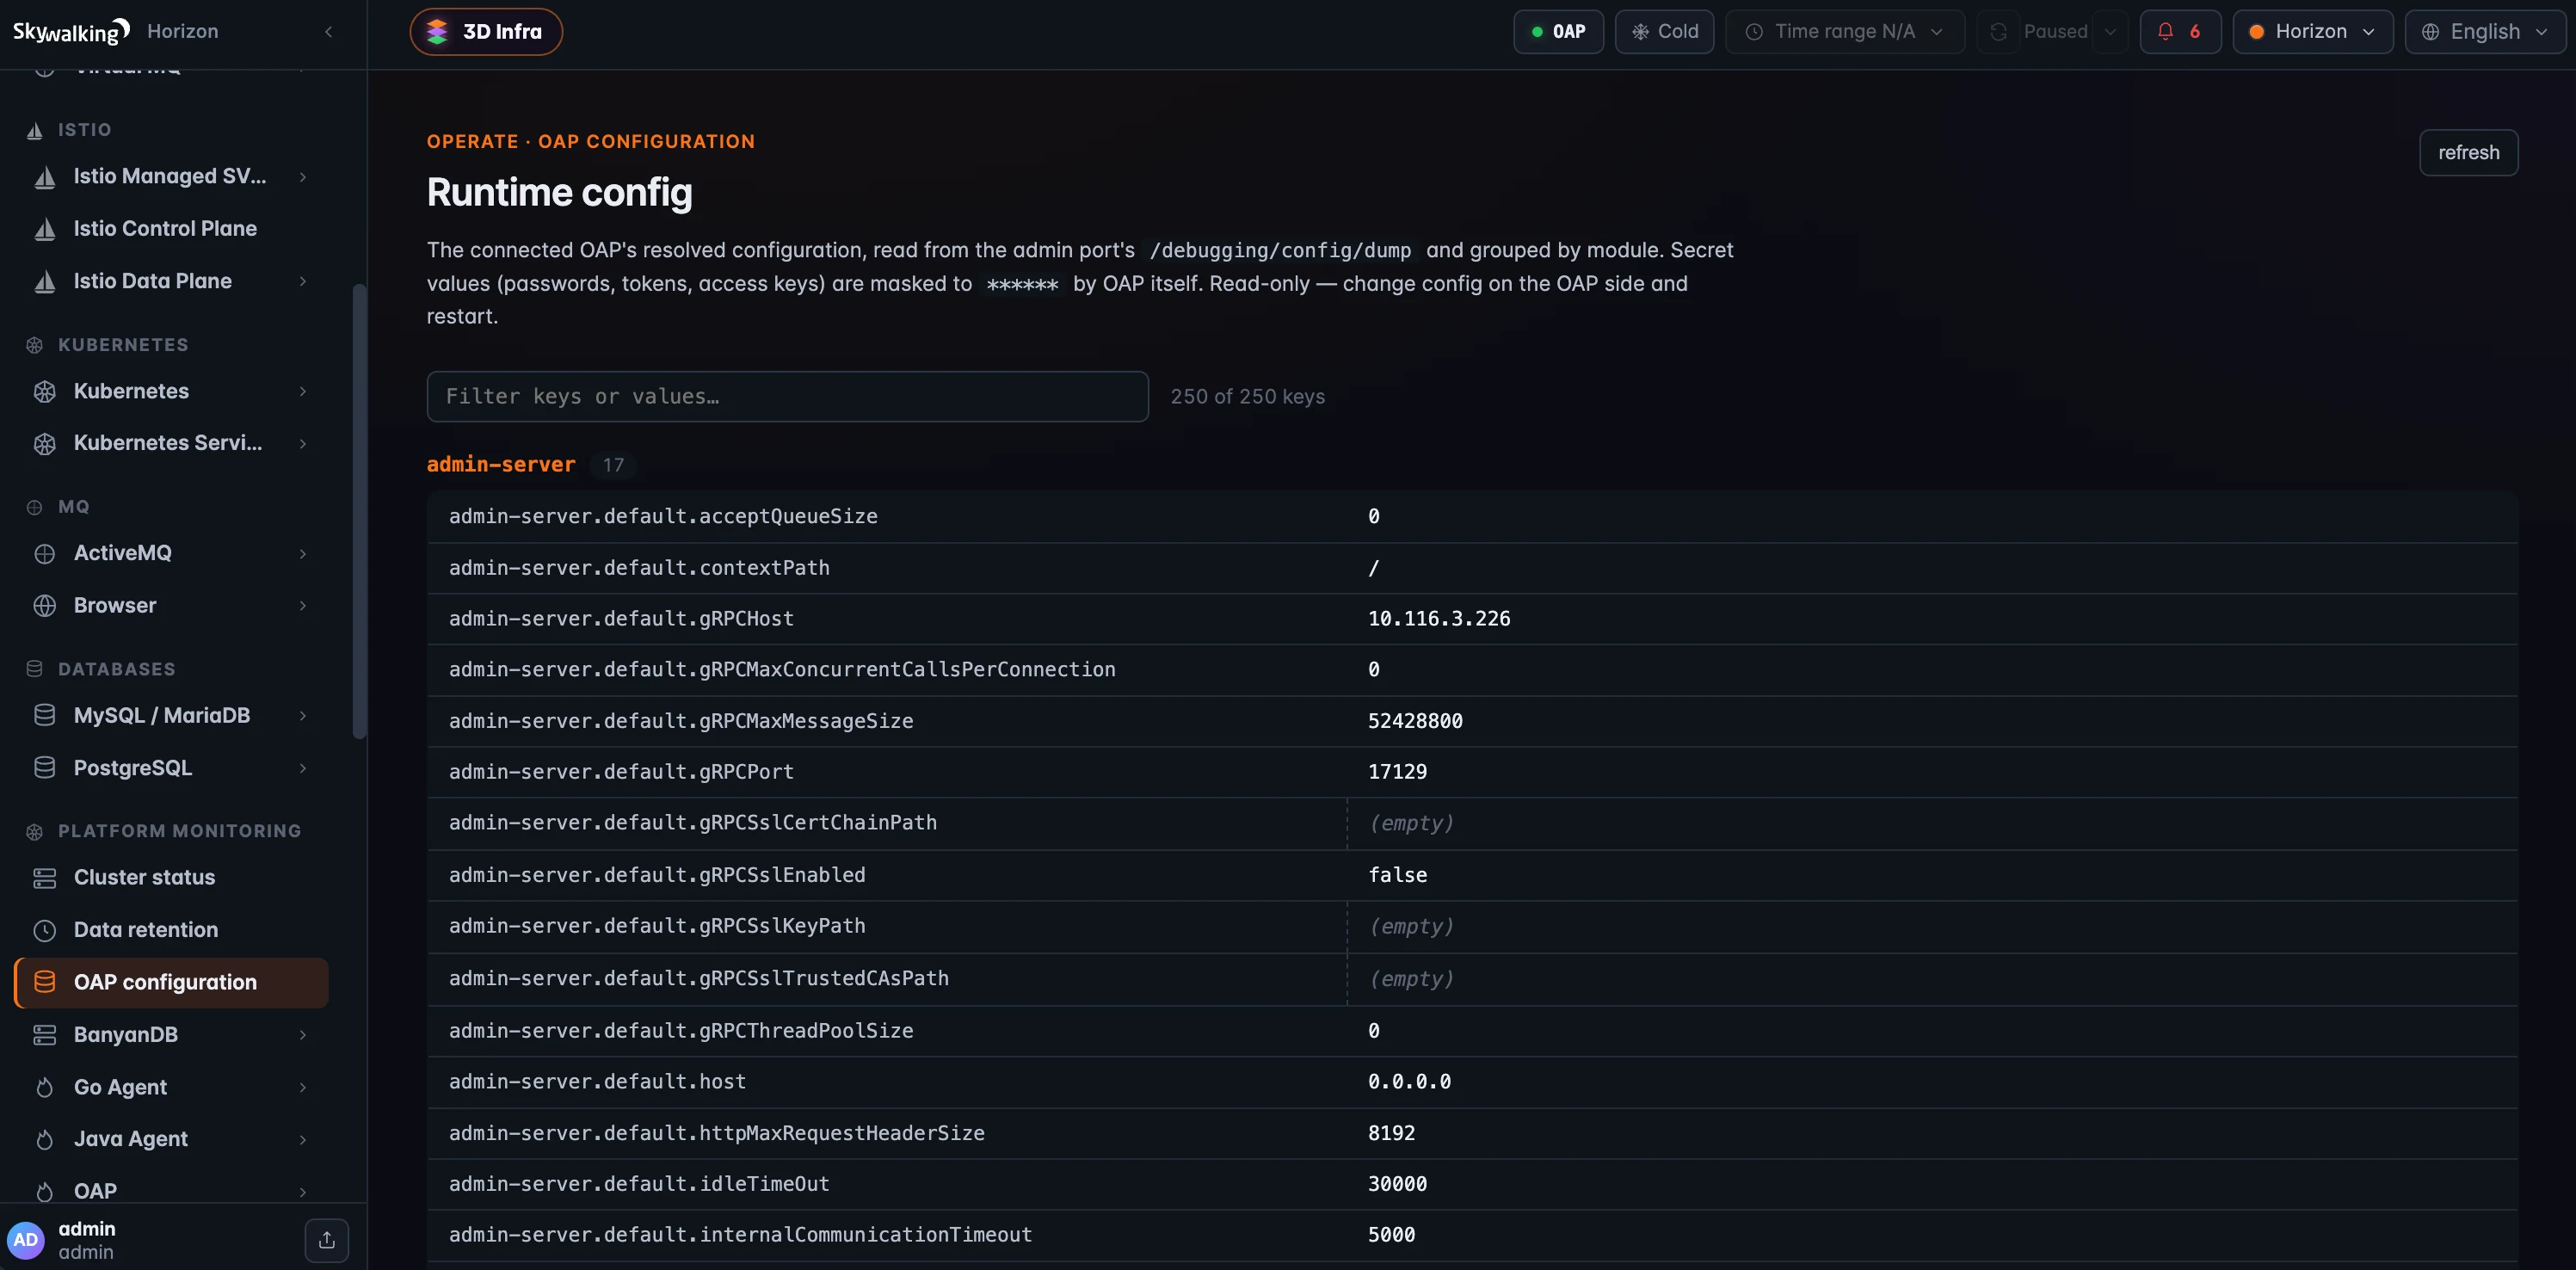 Figure 2: OAP Configuration — the connected backend’s resolved runtime config from the admin port, grouped by module and filterable, with secrets masked to
 ****** by OAP. Read-only: change config on the OAP side and restart.
Data Retention: how long does it keep your data?
Data Retention shows OAP’s time-to-live for each class of data, in whole days — records (trace, log, browser error, …) and metrics (metadata, minute, hour, day). And here the storage backend matters. On a flat store like Elasticsearch, each class has one retention number, full stop. On BanyanDB, data ages through configurable lifecycle stages — hot, optionally warm, optionally cold — and OAP reports the hot and warm stages as one combined, queryable window. So Horizon draws a per-class lifecycle bar instead of a single number: the hot+warm window plus the cold tail, with widths proportional to total days, so you read the relative durations at a glance.
There’s one operational subtlety the page calls out: the topbar Cold pill swaps reads from hot+warm to cold — it doesn’t union them — so it’s worth enabling only when the window you’re after is older than the hot+warm boundary. Data Retention reads through the standard query port, so unlike the two pages above it works on any OAP version.
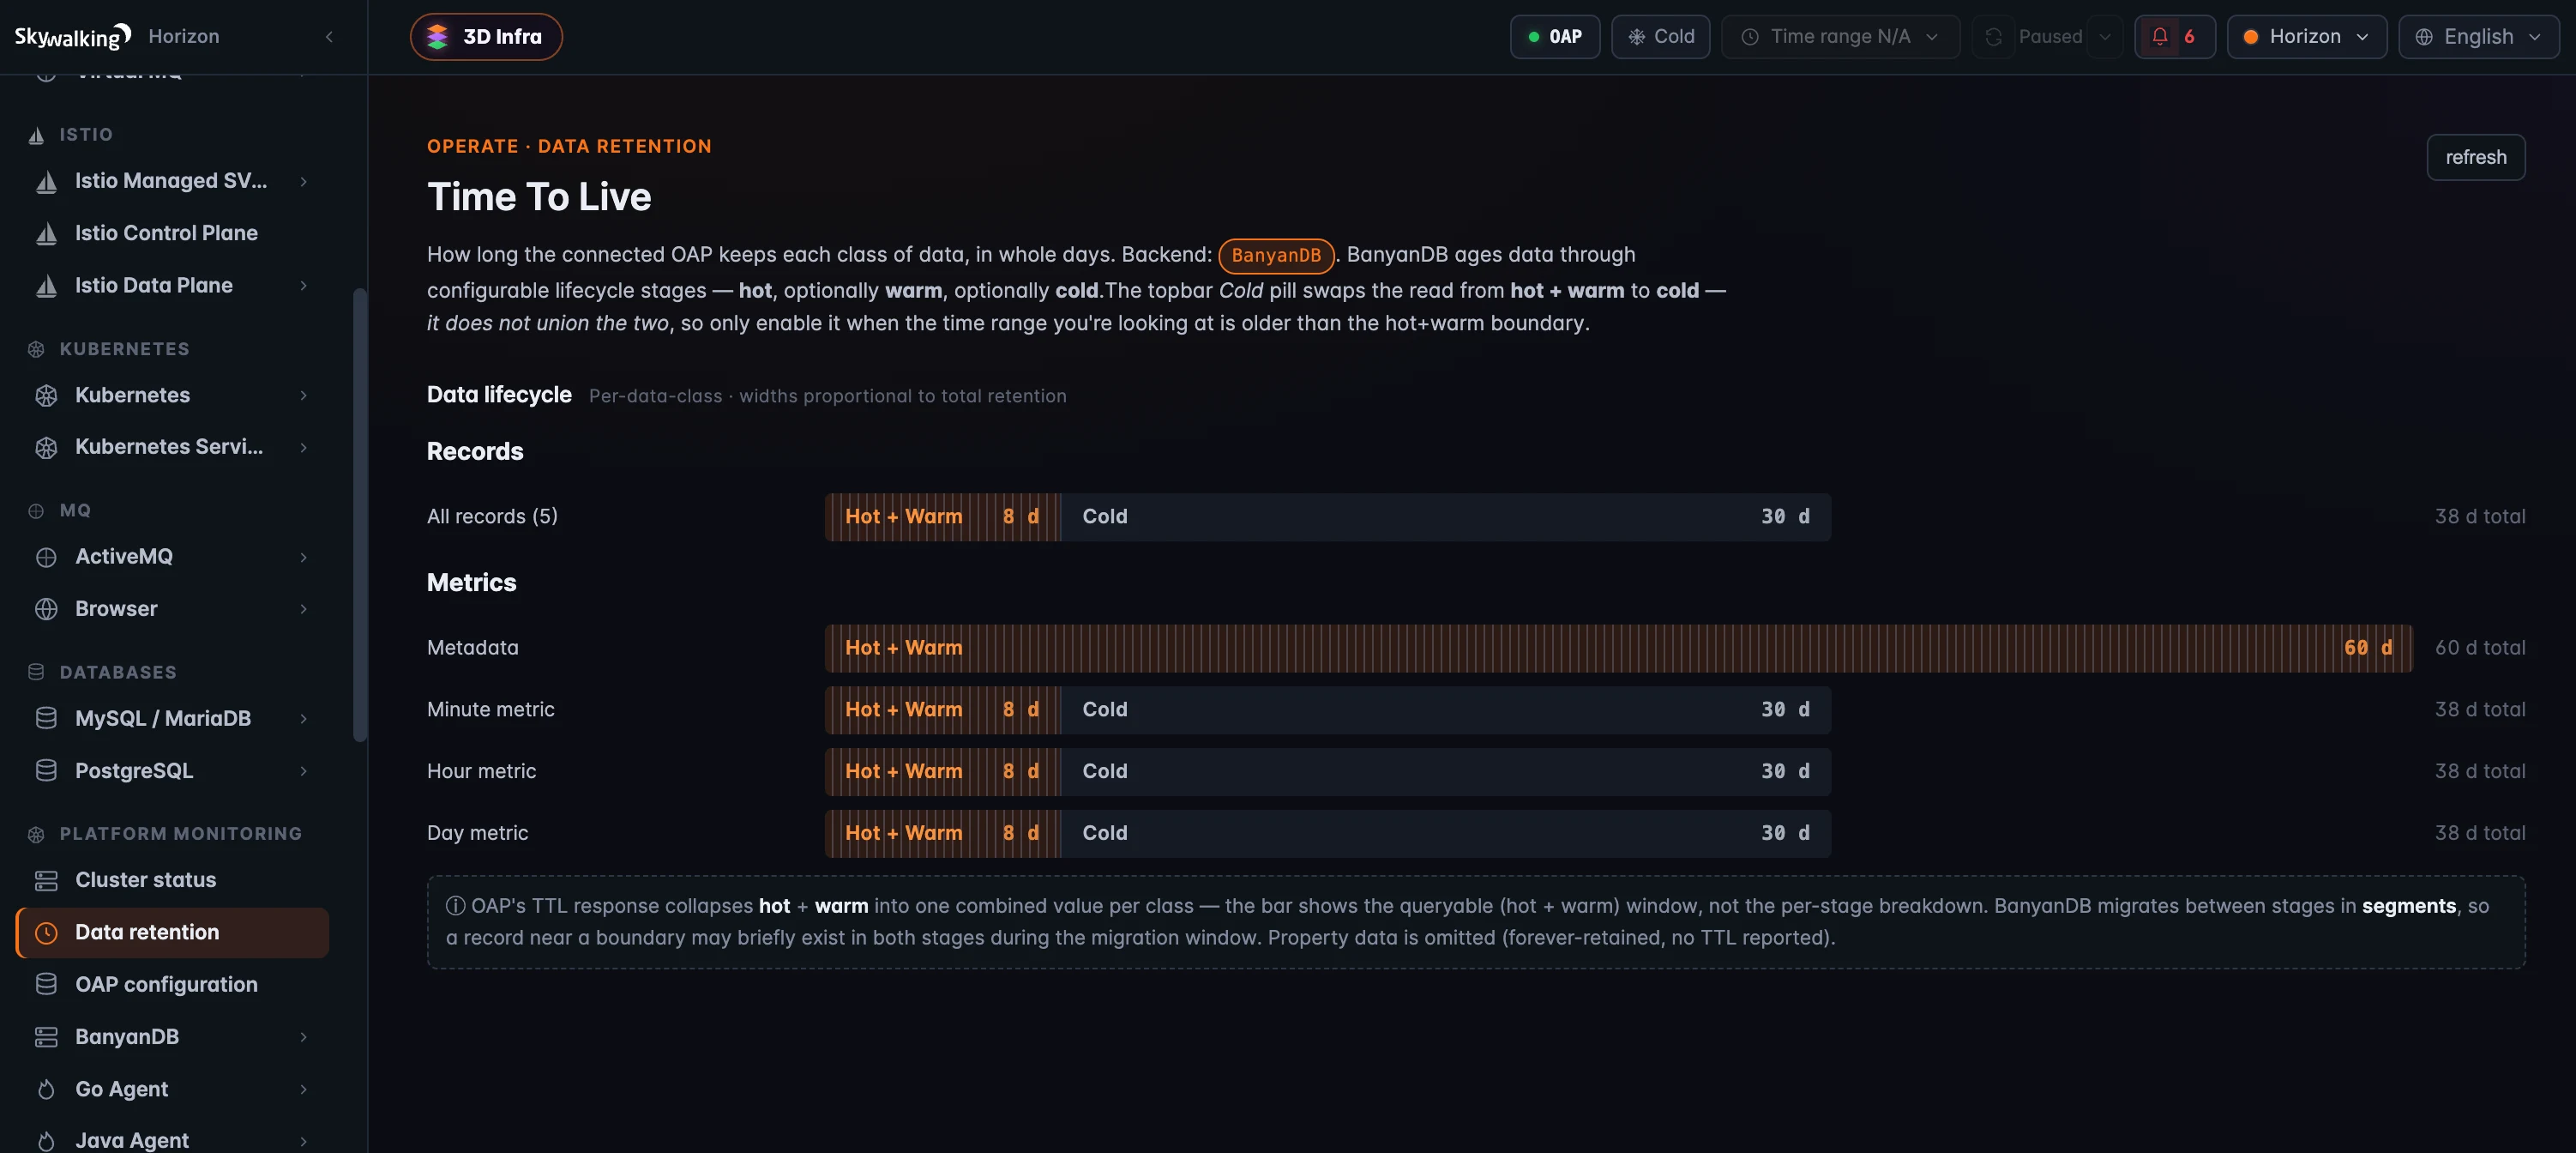 Figure 3: Data Retention — on BanyanDB, each class ages through hot → warm → cold, so Horizon draws lifecycle bars (the queryable hot+warm window plus cold, widths proportional to total days). A flat backend like Elasticsearch would show a single TTL per class instead.
Where it runs
All three live under Platform monitoring, each gated by its own read permission — cluster:read, config:read, ttl:read — and all three are strictly read-only: this is introspection, not control. They split on the backend the same way the rest of operate does. Data Retention and the Cluster-Status Query pane ride the standard query port, so they work on any OAP, 10.x included. The Cluster-Status Admin pane and OAP Configuration read the admin host, which arrives with OAP 11 — and rather than break when it’s absent, they say so plainly (a hidden pane, a “needs the admin host” banner). (These are about the platform’s health and config; the OAP self-observability dashboards are a separate, metrics-driven story.)
Where to go next
For the field reference — every pane, the config-dump shape, and the BanyanDB lifecycle details — see the Cluster Status, OAP Configuration, and Data Retention docs.
That closes Act 3 — operate it. Next up, Act 4 — govern & secure it, starting with Access Control & Security: server-enforced RBAC, LDAP/AD, the audit log, and break-glass.